Plotting a Map: OpenStreetMap Data on a Pen Plotter
Drawing with data instead of chance: a vsketch sketch that downloads a neighborhood from OpenStreetMap and turns its buildings, water, parks and tram tracks into lines at a fixed scale, and the step-by-step route from that map to the LY Drawbot.
Drawing with data instead of chance
The earlier plotter notes drew with chance: a maze, a flow field, circles, all from random numbers. This one draws something that exists: the Hofkwartier, the old streets around Noordeinde Palace in the center of The Hague. The lines come from a data set, and the program only decides which of them to draw and how large.
The tool is the same as in the vsketch note, which covers installing vsketch and what a sketch is. This note builds on it, and on the LY Drawbot note for the plotter itself.
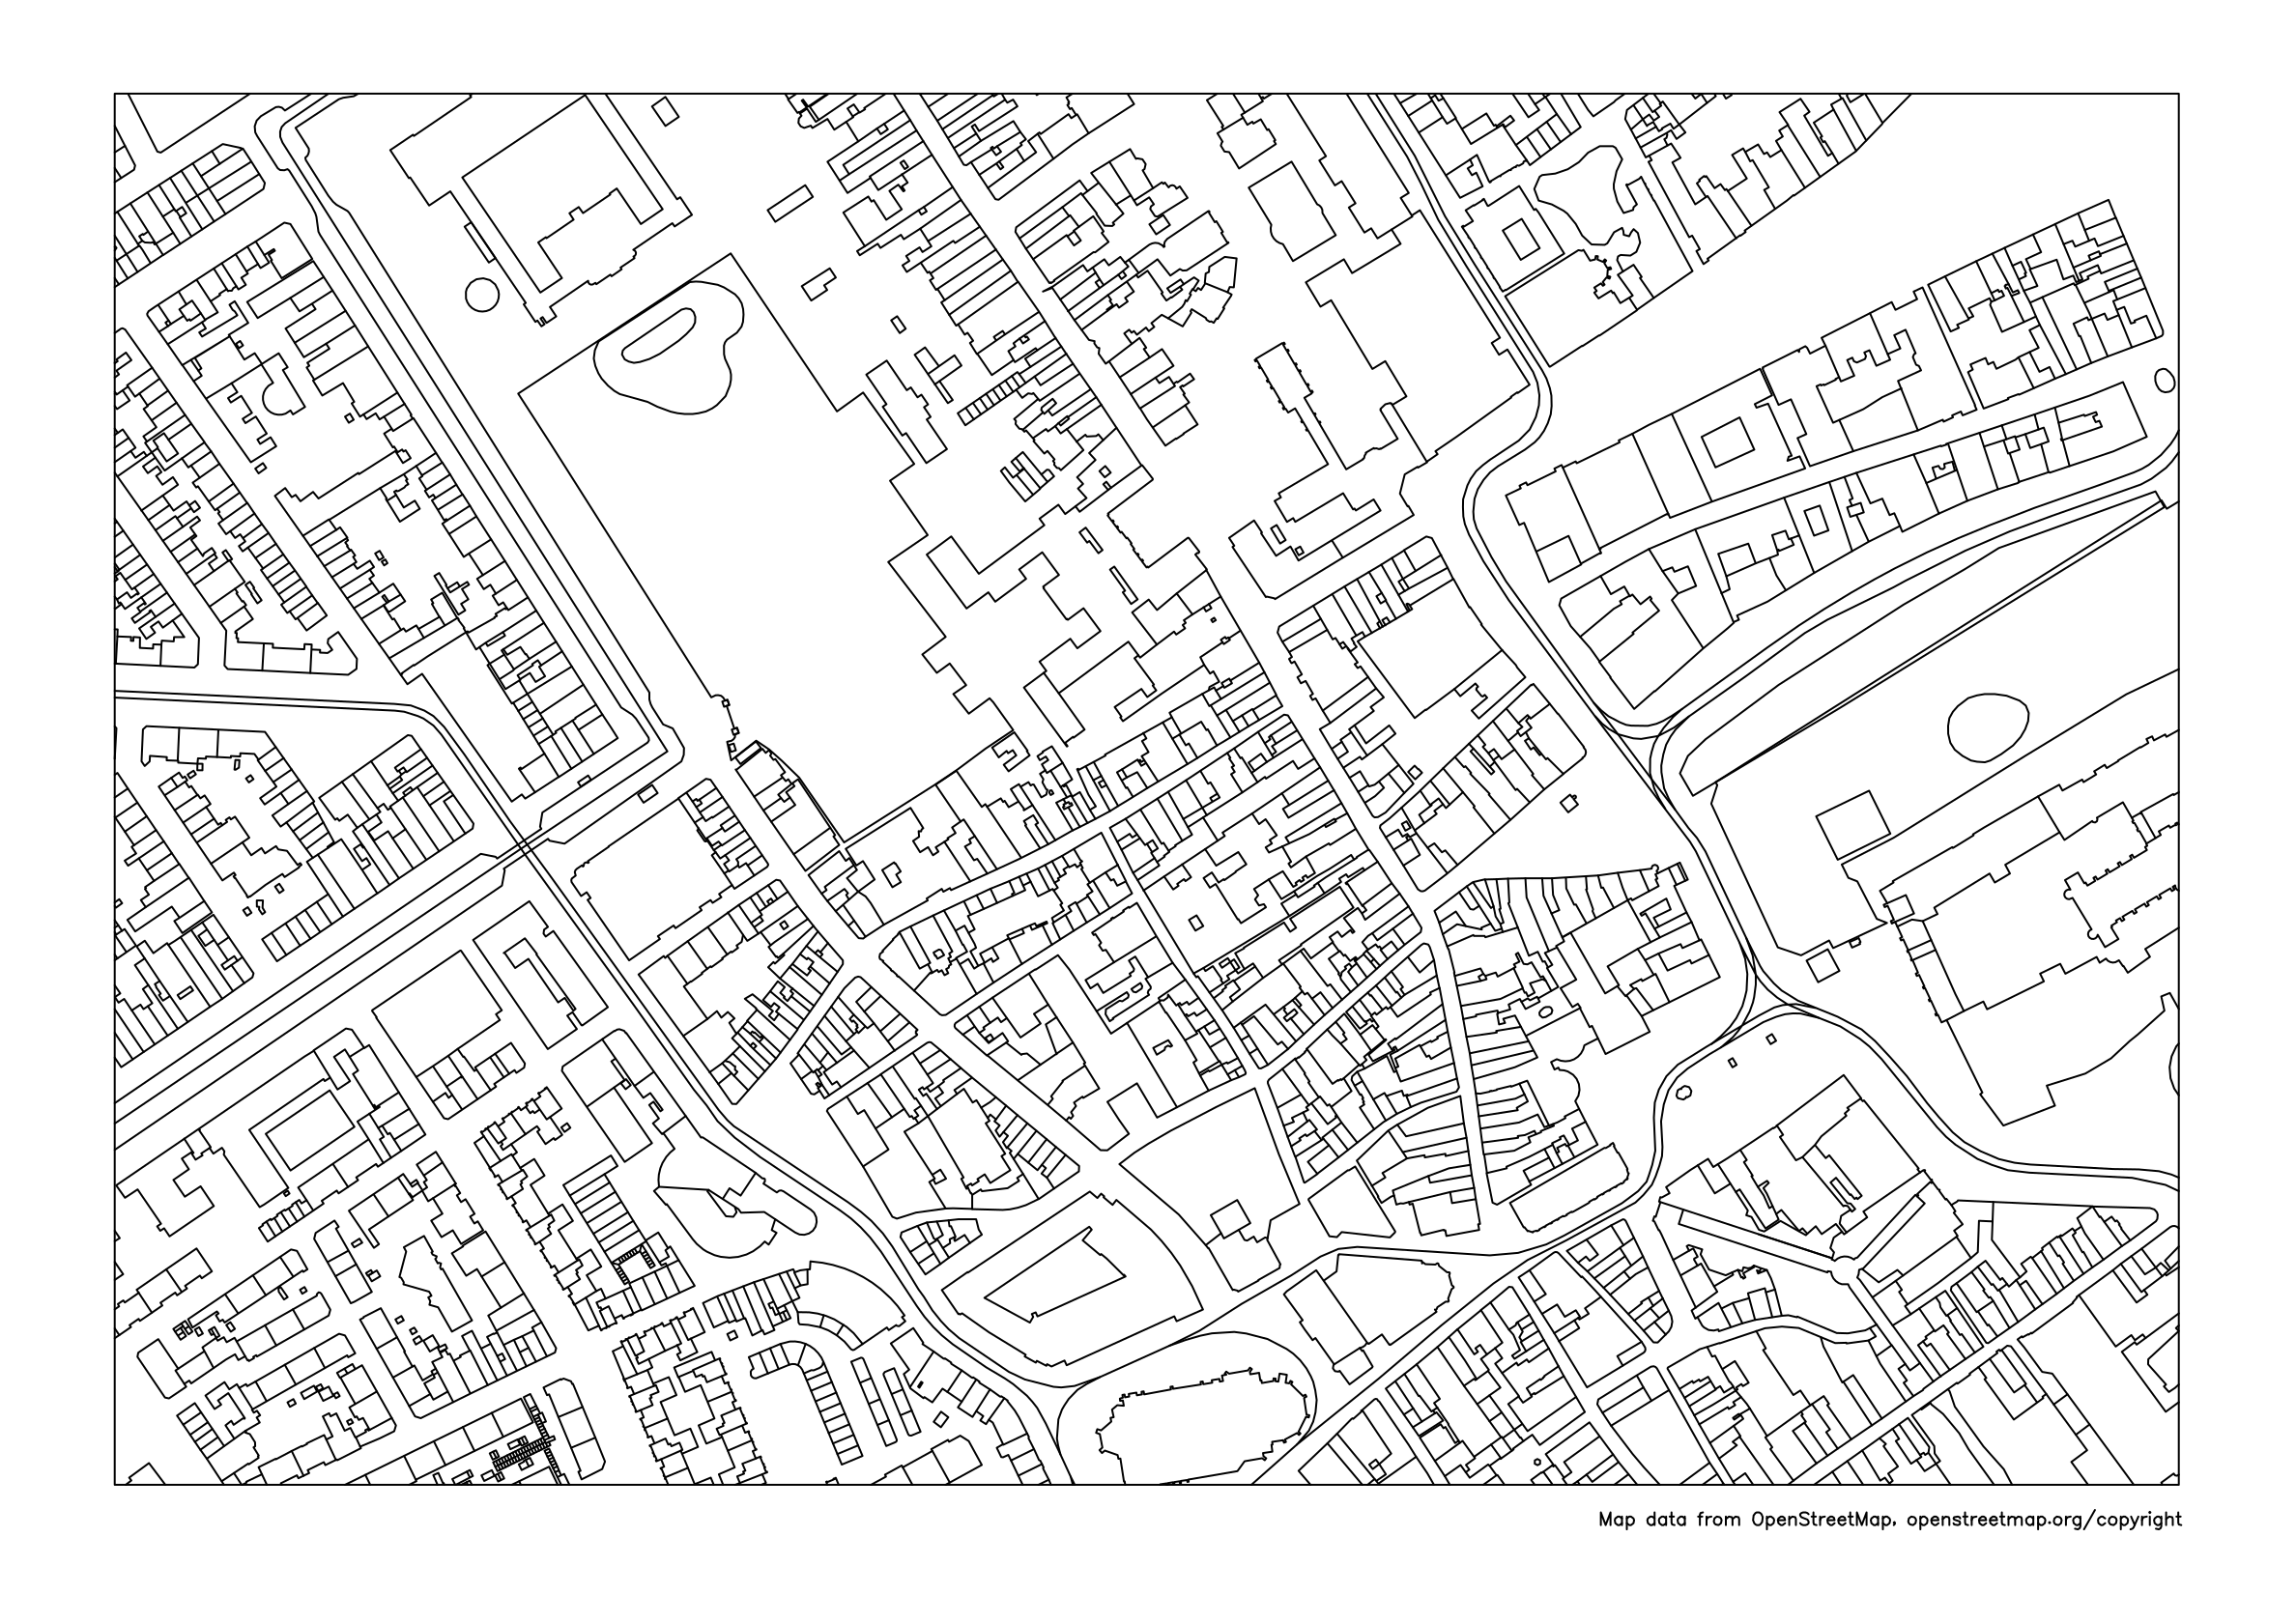
The data: OpenStreetMap
OpenStreetMap is a map of the world built by a community of mappers, and it is open data: anyone may use it, as long as they give credit (more on that below). Behind the map you see on the website sits a database with three kinds of elements:
- a node is one point, with a latitude and a longitude;
- a way is an ordered list of nodes: a line such as a street, or a closed outline such as a building;
- a relation groups elements that belong together, such as a building with a courtyard: an outer and an inner outline.
What an element is, is said by its tags: pairs of a key and a value. The sketch reads five kinds:
| Tag | Meaning | Layer in the sketch |
|---|---|---|
building=* |
The outline of a building | 1 · buildings |
natural=water, waterway=* |
Ponds and canals | 2 · water |
leisure=park |
The edge of a park | 3 · parks |
railway=tram |
Tram tracks | 4 · tram |
highway=* |
The center line of a street or path | 5 · streets (off by default) |
The star means "any value": a building can be tagged
building=yes, building=house or
building=church, and the sketch takes them all.
Asking for a piece of the map
You do not download the whole world. The Overpass API is a web service that answers questions about the OpenStreetMap data. The sketch sends it one query, which looks like this:
[out:json][timeout:90];
(
  way["building"](52.07717,4.29997,52.08283,4.31363);
  way["highway"](52.07717,4.29997,52.08283,4.31363);
  way["railway"="tram"](52.07717,4.29997,52.08283,4.31363);
  …
);
out geom;
The four numbers are the rectangle the map covers, in the order
south, west, north, east. out geom asks for the
coordinates of every point along with each way, and
[out:json] for the answer as
JSON, which
Python reads with its json module.
The sketch
vsk init osm_map creates a folder
osm_map with a file sketch_osm_map.py
(answer A4, landscape). Replace its contents with this sketch, or
download it as
sketch_osm_map.py:
"""A line map of a neighborhood for a pen plotter, from OpenStreetMap data.

The sketch downloads the map data once and keeps it in osm_data.json next to
this file. Change LAT, LON or SCALE and it downloads again.

Map data © OpenStreetMap contributors, available under the Open Database
License: https://www.openstreetmap.org/copyright
"""
import json
import math
import urllib.parse
import urllib.request
from pathlib import Path

import vsketch
from shapely.geometry import LineString, box
from shapely.ops import unary_union

LAT, LON = 52.0800, 4.3068  # center of the map: the Hofkwartier in The Hague
SCALE = 3500  # 1 mm on paper is 3.5 m on the ground
MAP_WIDTH, MAP_HEIGHT = 267, 180  # mm: A4 landscape with 15 mm margins

OVERPASS_URL = "https://overpass-api.de/api/interpreter"
CACHE = Path(__file__).with_name("osm_data.json")
CREDIT = "Map data from OpenStreetMap, openstreetmap.org/copyright"
METERS_PER_DEGREE = 111_320  # one degree of latitude, near enough
NO_STREET = {"footway", "path", "steps", "cycleway", "service", "pedestrian",
             "track", "corridor", "platform", "construction", "proposed",
             "elevator", "bridleway"}
WANTED = ('way["building"]', 'relation["building"]', 'way["highway"]',
          'way["natural"="water"]', 'relation["natural"="water"]',
          'way["waterway"]', 'way["railway"="tram"]',
          'way["leisure"="park"]', 'relation["leisure"="park"]')


def download(query):
    """Ask the Overpass API once; after that, read the saved answer."""
    if CACHE.exists():
        saved = json.loads(CACHE.read_text(encoding="utf-8"))
        if saved["query"] == query:
            return saved["elements"]
    print("Downloading from OpenStreetMap ...")
    request = urllib.request.Request(
        OVERPASS_URL,
        data=urllib.parse.urlencode({"data": query}).encode(),
        headers={"User-Agent": "osm-map-sketch/1.0 (pen plotter sketch)"},
    )
    try:
        with urllib.request.urlopen(request, timeout=120) as response:
            elements = json.load(response)["elements"]
    except OSError as error:  # no connection, a busy server, a refused certificate
        raise RuntimeError(f"Could not download the map data: {error}") from error
    CACHE.write_text(
        json.dumps({"query": query, "elements": elements}), encoding="utf-8"
    )
    return elements


def layer_of(tags):
    """Which layer does an element belong to? None means: leave it out."""
    if "building" in tags:
        return "buildings"
    if tags.get("natural") == "water" or "waterway" in tags:
        return "water"
    if tags.get("leisure") == "park":
        return "parks"
    if tags.get("railway") == "tram":
        return "tram"
    if "highway" in tags:
        if tags["highway"] in NO_STREET or tags.get("area") == "yes":
            return None
        return "streets"
    return None


def ways_of(element):
    """The lists of points of a way, or of every way in a relation."""
    if element["type"] == "way":
        return [element.get("geometry", [])]
    return [member["geometry"] for member in element.get("members", [])
            if member["type"] == "way" and member.get("geometry")]


def lines_in(shape):
    """The line parts of a shape; cutting can leave loose points behind."""
    return [part for part in getattr(shape, "geoms", [shape])
            if part.geom_type in ("LineString", "MultiLineString")]


class OsmMapSketch(vsketch.SketchClass):
    buildings = vsketch.Param(True)
    water = vsketch.Param(True)
    parks = vsketch.Param(True)
    tram = vsketch.Param(True)
    streets = vsketch.Param(False)  # center lines: a busier picture
    frame = vsketch.Param(True)
    credit = vsketch.Param(True)  # the line of text under the map

    def draw(self, vsk: vsketch.Vsketch) -> None:
        vsk.size("a4", landscape=True)  # the map is centered on the page
        vsk.scale("mm")

        # The piece of the world that fits on the paper at this scale.
        meters_per_mm = SCALE / 1000
        meters_per_degree_lon = METERS_PER_DEGREE * math.cos(math.radians(LAT))
        half_height = MAP_HEIGHT * meters_per_mm / 2 / METERS_PER_DEGREE
        half_width = MAP_WIDTH * meters_per_mm / 2 / meters_per_degree_lon
        south, north = LAT - half_height, LAT + half_height
        west, east = LON - half_width, LON + half_width

        def on_paper(point):
            """Latitude and longitude to millimeters; y runs down the page."""
            x = (point["lon"] - west) * meters_per_degree_lon / meters_per_mm
            y = (north - point["lat"]) * METERS_PER_DEGREE / meters_per_mm
            return x, y

        area = f"({south:.5f},{west:.5f},{north:.5f},{east:.5f})"
        query = ("[out:json][timeout:90];("
                 + "".join(f"{wanted}{area};" for wanted in WANTED)
                 + ");out geom;")

        layers = {"buildings": [], "water": [], "parks": [], "tram": [],
                  "streets": []}
        for element in download(query):
            name = layer_of(element.get("tags", {}))
            if name is None:
                continue
            for way in ways_of(element):
                if len(way) > 1:
                    layers[name].append(LineString([on_paper(p) for p in way]))

        paper = box(0, 0, MAP_WIDTH, MAP_HEIGHT)
        for number, name in enumerate(layers, start=1):
            if not getattr(self, name) or not layers[name]:
                continue
            # The union draws a wall shared by two buildings only once;
            # the intersection cuts everything off at the edge of the map.
            shape = unary_union(layers[name]).intersection(paper)
            vsk.stroke(number)
            for part in lines_in(shape):
                vsk.geometry(part)
        vsk.stroke(6)
        if self.frame:
            vsk.rect(0, 0, MAP_WIDTH, MAP_HEIGHT)
        if self.credit:
            vsk.text(CREDIT, MAP_WIDTH, MAP_HEIGHT + 4.5, size=2.5, align="right")

    def finalize(self, vsk: vsketch.Vsketch) -> None:
        vsk.vpype("linemerge linesimplify reloop linesort")


if __name__ == "__main__":
    OsmMapSketch.display()
How it works
-
The place is a constant, not a slider.
LAT,LONandSCALEare plain constants at the top. Avsketch.Paramwould become a slider in the viewer, and every move of that slider would send a new request to the server. The layers are parameters: switching one on or off needs no new data. - From scale to rectangle. At 1:3500, 1 mm on paper is 3.5 m on the ground. The map area is 267 by 180 mm (A4 landscape with 15 mm margins), so it shows 934.5 by 630 m around the center point.
-
From degrees to millimeters. One degree of
latitude is about 111,320 m everywhere. One degree of longitude
gets shorter toward the poles, by the cosine of the latitude: at
52° north it is about 68,400 m.
on_paper()uses those two numbers to turn a point into millimeters from the top left corner; the y axis runs down the page, so north is up. This treats the ground as flat, which is fine for a neighborhood and would not be for a country. - The query is the key to the saved file. The file holds the query next to the answer. Change the center or the scale and the query changes, so the sketch downloads again; otherwise it never does.
-
Shared walls only once. In a street of terraced
houses, every house is its own outline, so the wall between two
neighbors is in the data twice.
unary_unionfrom Shapely (it comes with vsketch) merges all lines of a layer and keeps overlapping pieces once. For this map that takes the buildings from 21.7 m of line to 16.1 m: a quarter less to plot, and no wall drawn twice with wet ink. -
Cut at the edge.
intersection(paper)cuts every line off at the map's rectangle. Without it, a building that sticks out of the area would be drawn into the margin. -
One layer per kind.
vsk.stroke(number)puts each kind of line on its own layer; the frame and the credit line share layer 6. - finalize. The same four vpype commands as in the vsketch note: join lines that touch, simplify, and sort them so the pen travels less.
Running it
cd osm_map
vsk run
The first run prints
Downloading from OpenStreetMap ... and takes a little
longer; after that the map appears at once. The checkboxes switch
the layers on and off. streets adds the center line of
every street, which gives a busier picture; without it the streets
are simply the space between the buildings. Press
LIKE! and the SVG is saved in
output as osm_map_liked_1.svg.
When I ran it on 10 November 2026, the server returned 1,834 elements for this rectangle, and the finished map had about 1,600 lines with 19.6 m of ink. OpenStreetMap changes every day, so your numbers will differ a little.
From map to plot, step by step
-
Make. In the sketch folder,
vsk run, choose the layers, press LIKE!. The SVG is inoutput. -
Convert to millimeters. vsketch saves its
coordinates in pixels, and the LY Drawbot's extension reads them
as millimeters (the
vsketch note
explains why). Convert with
svg_to_mm.py, run with
vsketch's own Python:
It worked when it prints& "$env:LOCALAPPDATA\pipx\pipx\venvs\vsketch\Scripts\python.exe" svg_to_mm.py output\osm_map_liked_1.svg osm_map_mm.svg297 x 210 mm. The converter puts all layers in one file for one pen. -
Make the G-code. Open
osm_map_mm.svgin Inkscape and run the LY Drawbot extension as in the LY Drawbot note. The file already has paths only, in millimeters. - Check. Open the G-code in UGS. In the visualizer the map must stay within 310 by 210 mm; this one runs from about 15 to 282 mm wide and 12 to 198 mm high.
- Plot. Tape the paper down, set the zero point and start. A map is many short lines, so the pen lifts about 1,600 times: use a pen that starts cleanly, and see that the paper cannot shift.
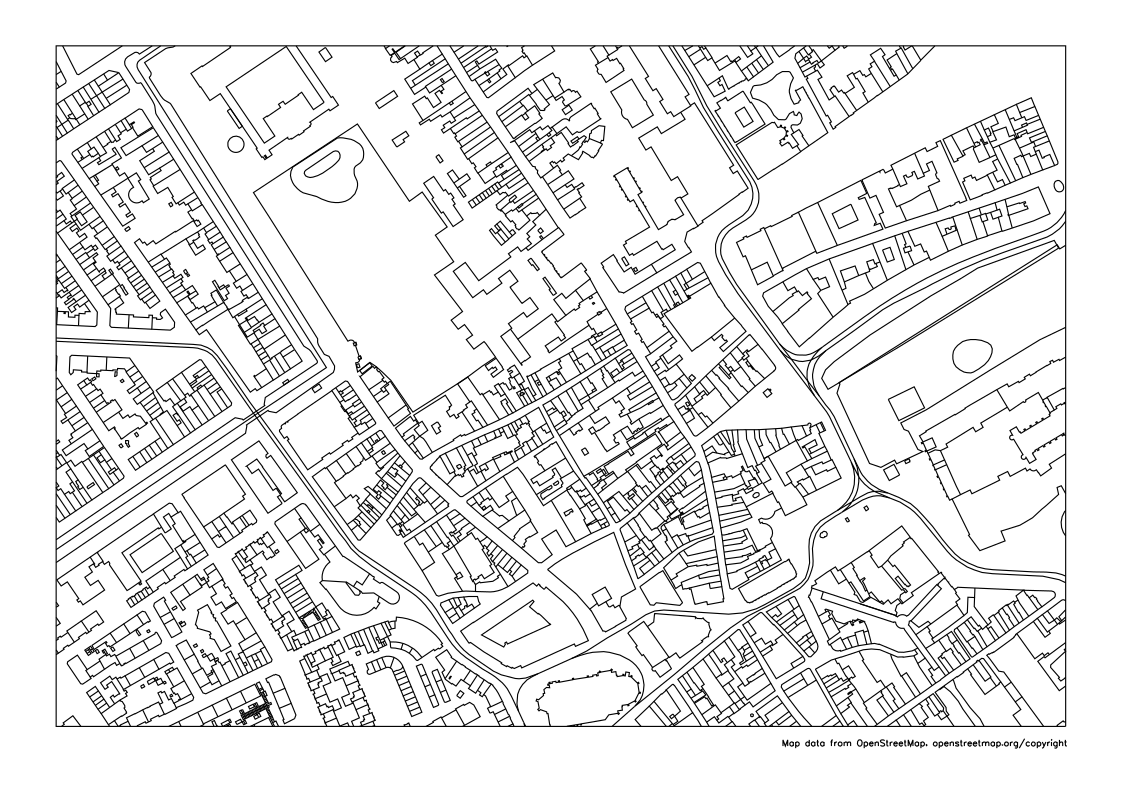
Prefer to go straight to the plotter? Here is the finished map, already in millimeters: hofkwartier-map.svg.
Your own map
Change the three constants at the top of the sketch and save the
file. To find the numbers, look up a place on
openstreetmap.org: the
address bar ends in something like
#map=17/52.0800/4.3068, which is the zoom level, the
latitude and the longitude of the middle of the screen.
SCALE |
1 mm on paper | Area on A4 |
|---|---|---|
| 2000 | 2 m | 534 by 360 m |
| 3500 | 3.5 m | 934 by 630 m |
| 5000 | 5 m | 1,335 by 900 m |
| 9000 | 9 m | 2,403 by 1,620 m |
- More area means more lines. An old city center at 1:9000 is thousands of tiny buildings; a suburb or a village can take a larger area. Look at the drawing in the viewer before you plot.
-
Latitude first. Swap
LATandLONand you get a piece of another part of the world, most likely empty. - Think before you share. A map centered on your own house tells everyone where you live. For a plot you post online, a public place a few streets away makes a better center.
Credit
OpenStreetMap's data is free to use, on one condition: you credit
OpenStreetMap and make clear that the data is available under the
Open Database License, for instance by pointing to
openstreetmap.org/copyright. That holds for a plot you show to others as well. The
attribution guidelines
ask for the credit on the work itself where that is possible, which
is why the sketch plots a small line of text under the map. Switch
credit off only if you put the credit somewhere else,
such as beside the plot.
When it goes wrong
"Could not download the map data". The rest of the message says why. A timeout or an HTTP error such as 502 or 504 means the server is busy: wait a minute and run the sketch again. Nothing is lost, and once the download has worked it is not needed again.
"certificate verify failed". The message contains
CERTIFICATE_VERIFY_FAILED: Python does not trust the
server's certificate and refuses the connection, so nothing is
downloaded. I got this on my Windows laptop, ending in
certificate has expired, on a day when the server's
certificate was valid. The cause was on the laptop, and I have not
found it yet. Python on Windows checks certificates against the
certificate store of Windows itself, so two things are worth
checking: that the computer's date and time are right, and that
Windows has its updates. Do not switch the check off in the code: it
is what tells you that you are talking to the real server.
What got me going was skipping the download. The sketch only
downloads when there is no osm_data.json with the same
query next to it, so I put a ready-made one there:
- Download osm_data.json (1.6 MB): the map data of the Hofkwartier as the server returned it on 10 November 2026, © OpenStreetMap contributors, under the Open Database License.
-
Put it in the sketch folder, next to
sketch_osm_map.py. -
Run
vsk runagain. The map appears withoutDownloading from OpenStreetMap ....
The file only fits the sketch as it is. Change LAT,
LON or SCALE and the query changes, so the
sketch downloads again: for your own map the connection has to work.
An empty frame. The rectangle has nothing in it:
check that LAT and LON are not swapped and
that the point is on land.
The viewer is slow. Too many lines: use a smaller
SCALE number (less area) or switch layers off.
The plot is far too large. Step 2 was skipped: the file still has its coordinates in pixels.
The plot
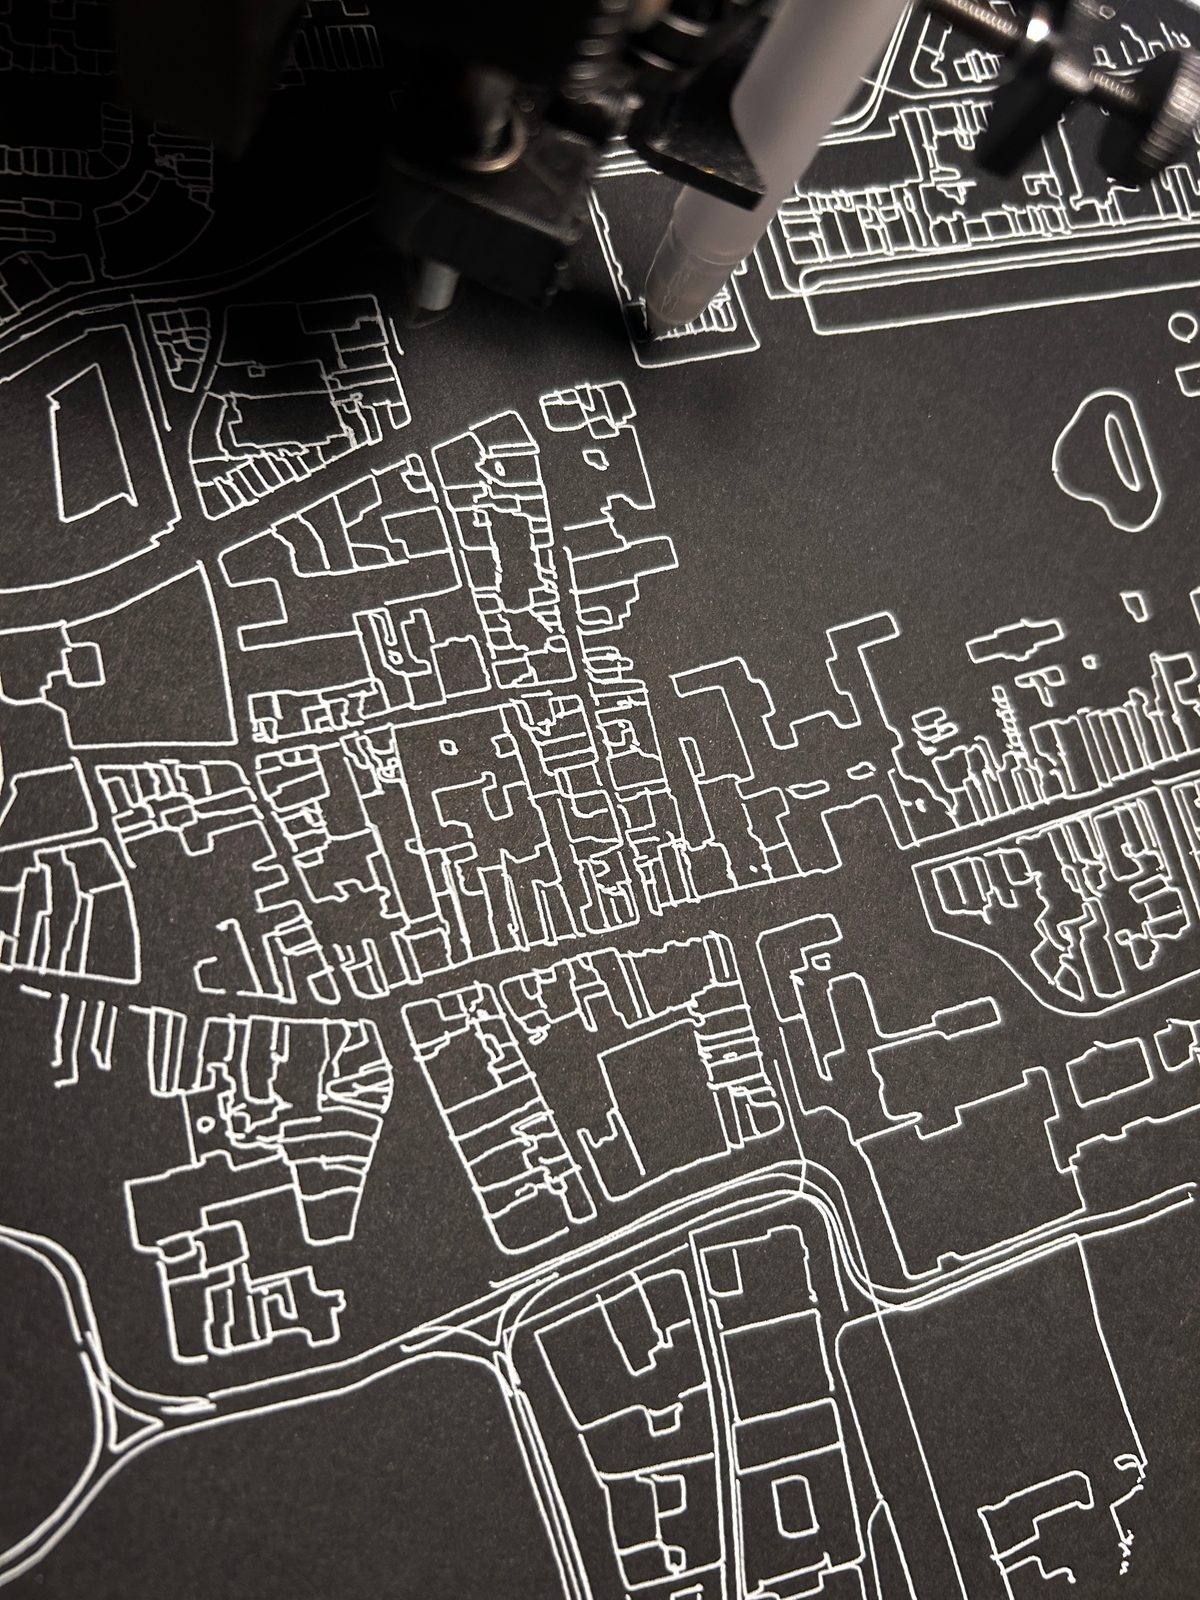
streets layer switched on. Pen: Sakura Gelly Roll,
bright white, Medium 08 (0.4 mm). Paper: Canson Graduate, deep
black, smooth, 240 g/m², A4. Map data © OpenStreetMap
contributors. Select the image to enlarge it.
This plot is not perfect. While it was running, it turned out that I had not tightened the pen in its holder properly: a few lines were not drawn, and when I tightened the pen, the plot shifted a tiny bit. A "failed" plot, then, but making mistakes is exactly what teaches you something here. And I can plot the map again as often as I like, until it is right.
Sources
- About and Copyright and License, OpenStreetMap
- Attribution Guidelines, OpenStreetMap Foundation
- Elements and Overpass API, OpenStreetMap Wiki: nodes, ways, relations and tags, the order of the bounding box, the state of the public server
- Overpass API manual: Commons, for the usage guideline
-
vsketch documentation, for
geometry,strokeandtext -
Shapely documentation, for
unary_unionandintersection