p5.js: Drawing for a Pen Plotter in the Browser
Generative drawings in JavaScript: what p5.js is, how to start with nothing more than a browser, saving lines instead of pixels, and a flow field that comes out in millimeters, ready for the LY Drawbot.
What p5.js is
The vsketch note made plotter drawings with Python. p5.js does the same with JavaScript, in the browser. Lauren Lee McCarthy created it in 2013 as a new interpretation of Processing for the web. Processing itself was started in 2001 by Casey Reas and Ben Fry at the MIT Media Lab, to teach programming through pictures. Both are free and open source and supported by the Processing Foundation; p5.js has a large community, with a rotating leadership since 2020.
-
A sketch has a
setup()function that runs once and adraw()function that runs again for every frame (60 per second by default).noLoop()stops that after the first frame, which is what a drawing for a plotter wants. -
Drawing commands such as
line(),ellipse()andbeginShape()/vertex()/endShape(), and helpers for generative work:random(),noise(),map(). - The reference has an example for every function, and the web editor runs sketches without installing anything.
Pixels or lines
p5.js draws on a <canvas>: pixels, like a photo.
A plotter cannot do anything with a PNG; it needs the lines
themselves. The add-on
p5.js-svg, by
Zeno Zeng, replaces the canvas with an
<svg> element. With
createCanvas(w, h, SVG) every line becomes a
<path>, which is exactly what the LY Drawbot's
Inkscape extension
reads, and save("name.svg") saves it.
What p5.js does not have, unlike vsketch, is anything made for plotters: no millimeters and no optimizing of the lines. The example below does both itself, in a few lines.
p5.js 1 and p5.js 2
p5.js 2.0 came out in April 2025; the newest version is 2.3.4 (25 September 2026). Version 1 is still maintained: 1.11.13 is from 8 April 2026. The README of p5.js-svg 1.6.0 says it is compatible with p5.js 1.11.x, so for plotter work you use p5.js 1.11.13. The script tags in this note load both with their exact version:
<script src="https://cdn.jsdelivr.net/npm/p5@1.11.13/lib/p5.min.js"></script>
<script src="https://cdn.jsdelivr.net/npm/p5.js-svg@1.6.0/dist/p5.svg.js"></script>Getting started
There are two ways, and neither installs anything.
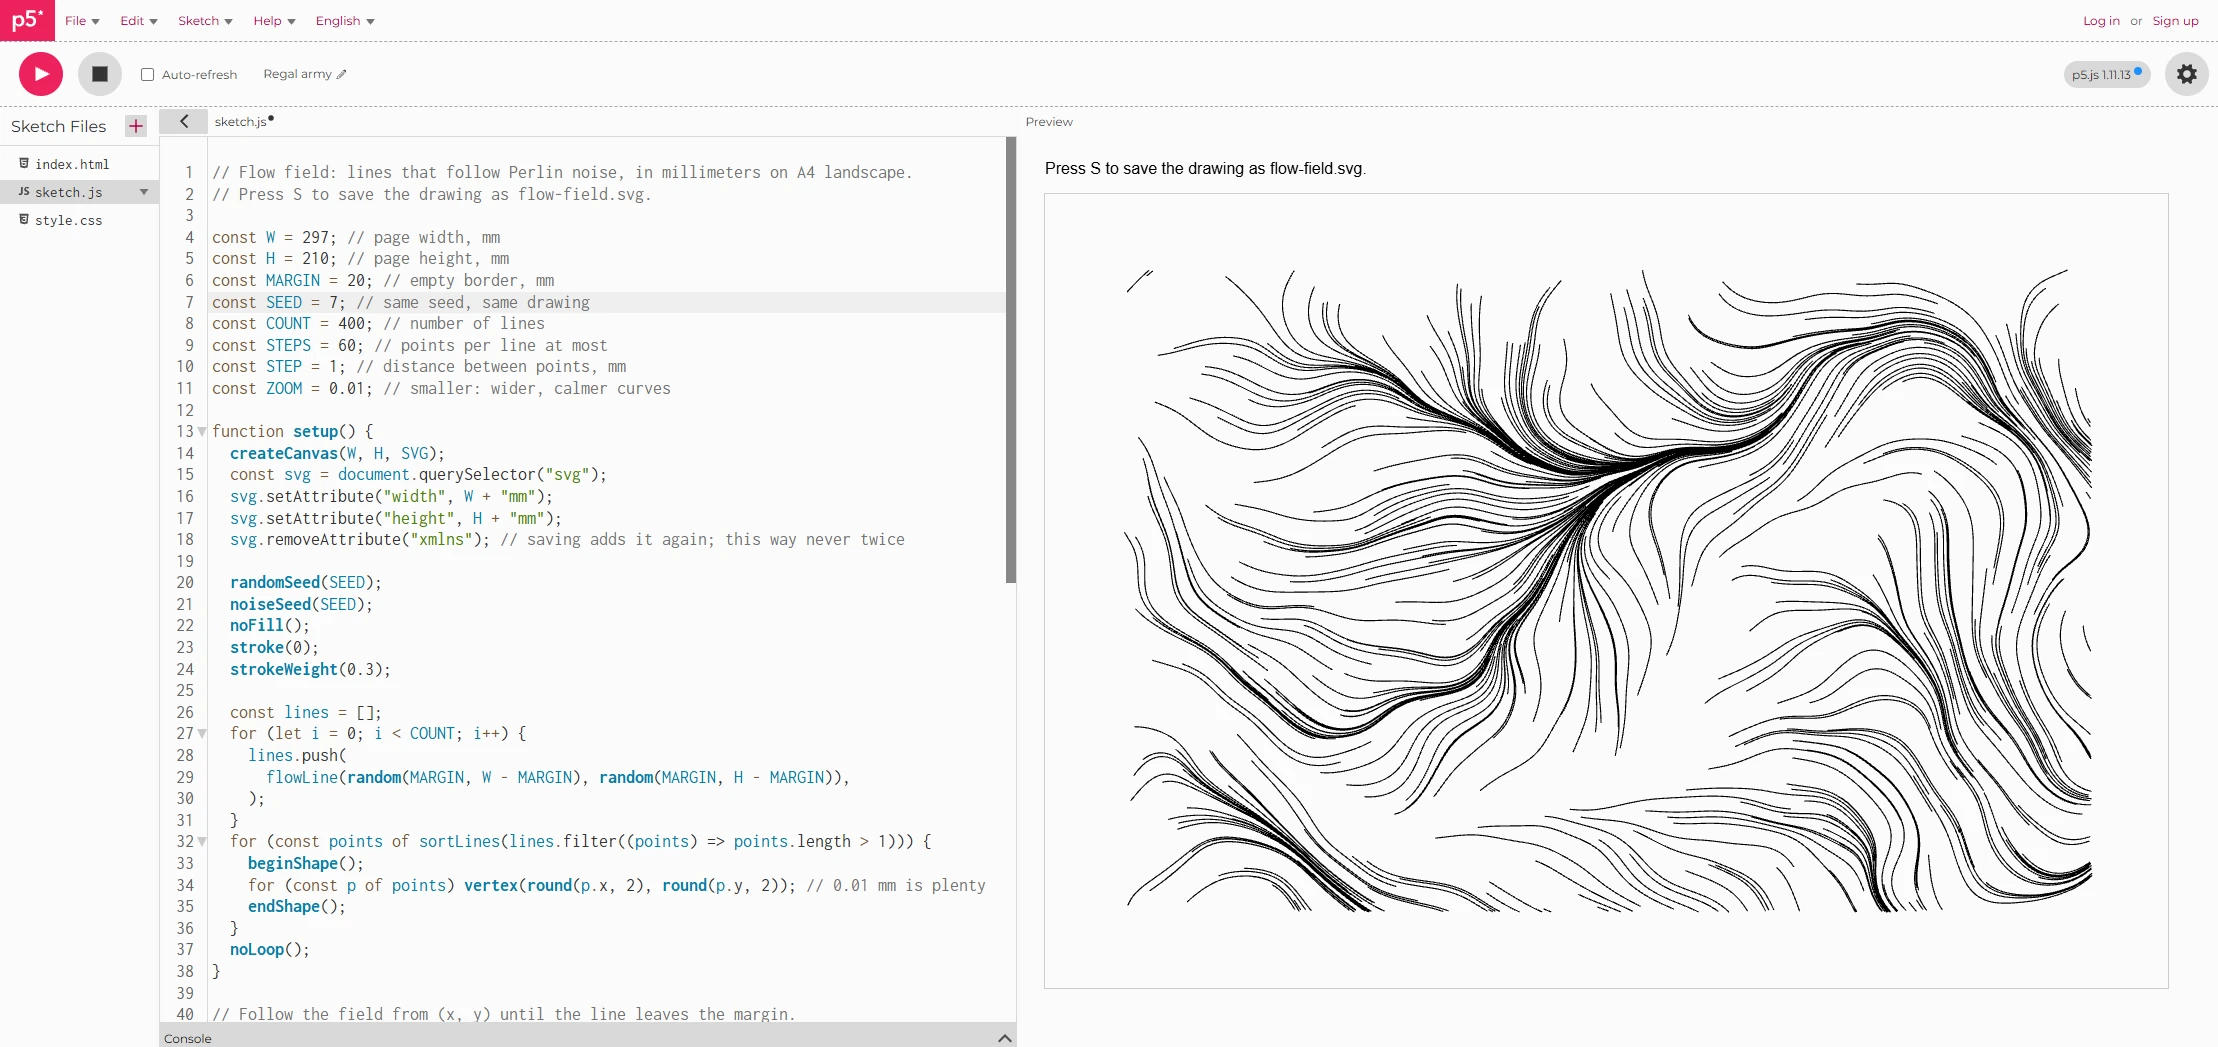
In the web editor
Open editor.p5js.org. An
account is only needed to save sketches online. Open
index.html in the file list (the arrow at the top
left), check that the p5.js line loads a 1.11 version or replace it
with the one above, and add the p5.js-svg line under it. Paste the
sketch into sketch.js and press Play.
On your own computer
A p5.js sketch is an ordinary web page: an
index.html that loads p5.js, p5.js-svg and your
sketch.js. Put the two files in one folder and open
index.html in Chrome, Edge or Firefox with a double
click. No web server is needed. The two libraries come from the
internet; to work offline, download the two files from the addresses
above, put them in the folder, and change the src to
their file names.
<!doctype html>
<html lang="en">
  <head>
    <meta charset="utf-8" />
    <title>Flow field</title>
    <script src="https://cdn.jsdelivr.net/npm/p5@1.11.13/lib/p5.min.js"></script>
    <script src="https://cdn.jsdelivr.net/npm/p5.js-svg@1.6.0/dist/p5.svg.js"></script>
    <style>
      body {
        margin: 24px;
        font-family: sans-serif;
      }
      svg {
        outline: 1px solid #ccc; /* the edge of the A4 page */
      }
    </style>
  </head>
  <body>
    <p>Press S to save the drawing as flow-field.svg.</p>
    <script src="sketch.js"></script>
  </body>
</html>
The example: a flow field
A flow field fills the page with invisible arrows, like wind or a
current. Each line starts at a random point and follows the arrows,
one millimeter at a time. The arrows come from
noise(), p5.js's Perlin noise: random numbers that
change smoothly from one place to the next, so neighboring arrows
point almost the same way and the lines bend together, like combed
hair.
// Flow field: lines that follow Perlin noise, in millimeters on A4 landscape.
// Press S to save the drawing as flow-field.svg.

const W = 297; // page width, mm
const H = 210; // page height, mm
const MARGIN = 20; // empty border, mm
const SEED = 7; // same seed, same drawing
const COUNT = 400; // number of lines
const STEPS = 60; // points per line at most
const STEP = 1; // distance between points, mm
const ZOOM = 0.01; // smaller: wider, calmer curves

function setup() {
  createCanvas(W, H, SVG);
  const svg = document.querySelector("svg");
  svg.setAttribute("width", W + "mm");
  svg.setAttribute("height", H + "mm");
  svg.removeAttribute("xmlns"); // saving adds it again; this way never twice

  randomSeed(SEED);
  noiseSeed(SEED);
  noFill();
  stroke(0);
  strokeWeight(0.3);

  const lines = [];
  for (let i = 0; i < COUNT; i++) {
    lines.push(
      flowLine(random(MARGIN, W - MARGIN), random(MARGIN, H - MARGIN)),
    );
  }
  for (const points of sortLines(lines.filter((points) => points.length > 1))) {
    beginShape();
    for (const p of points) vertex(round(p.x, 2), round(p.y, 2)); // 0.01 mm is plenty
    endShape();
  }
  noLoop();
}

// Follow the field from (x, y) until the line leaves the margin.
function flowLine(x, y) {
  const points = [];
  for (let s = 0; s < STEPS; s++) {
    if (x < MARGIN || x > W - MARGIN || y < MARGIN || y > H - MARGIN) break;
    points.push({ x, y });
    const angle = noise(x * ZOOM, y * ZOOM) * TWO_PI * 2;
    x += cos(angle) * STEP;
    y += sin(angle) * STEP;
  }
  return points;
}

// Draw the nearest line next, from whichever end is closer,
// so the pen travels less with the pen up.
function sortLines(lines) {
  const sorted = [];
  let pen = { x: 0, y: H }; // the plotter's zero point: bottom left
  while (lines.length > 0) {
    let best = 0;
    let bestDist = Infinity;
    let flip = false;
    for (let i = 0; i < lines.length; i++) {
      const first = lines[i][0];
      const last = lines[i][lines[i].length - 1];
      const toFirst = dist(pen.x, pen.y, first.x, first.y);
      const toLast = dist(pen.x, pen.y, last.x, last.y);
      if (toFirst < bestDist) [best, bestDist, flip] = [i, toFirst, false];
      if (toLast < bestDist) [best, bestDist, flip] = [i, toLast, true];
    }
    const next = lines.splice(best, 1)[0];
    if (flip) next.reverse();
    sorted.push(next);
    pen = next[next.length - 1];
  }
  return sorted;
}

function keyPressed() {
  if (key === "s" || key === "S") save("flow-field.svg");
}
What it does:
-
createCanvas(W, H, SVG)makes a 297 by 210 canvas, so every number in the sketch is a millimeter. The twosetAttributelines putmmafter the page size; without them the file says 297 by 210 pixels, and Inkscape makes it 78 by 56 millimeters. TheremoveAttributeline prevents a small fault: p5.js-svg also writes thexmlnsattribute itself, and saving can then put it in the file twice, which makes the file invalid. -
randomSeed()andnoiseSeed()fix the randomness: the sameSEEDgives the same drawing, another seed a new one. -
In
flowLine(),noise(x * ZOOM, y * ZOOM)gives a number between 0 and 1 for the current point, which becomes an angle of up to two full turns.cos()andsin()turn the angle into a step of one millimeter (see sine and cosine).ZOOMdecides how fast the field changes: smaller gives wider, calmer curves. -
vertex(round(p.x, 2), round(p.y, 2))rounds to a hundredth of a millimeter, far finer than a pen. Without rounding every coordinate has 15 decimals and the file is more than twice as large. -
sortLines()decides the order and the direction of the lines; see below. -
keyPressed()saves the drawing when you press S.
Order and direction
A plotter draws the lines in the order of the file. Between two lines it lifts the pen and travels to the start of the next one. In the order the sketch makes them, the 397 lines lie all over the page, and the pen would travel 46.6 meters lifted for 20.3 meters of drawing.
The LY Drawbot's Inkscape extension already sorts a little: each
time it picks the line whose start is nearest to where the
pen is. That brings the 46.6 meters down to 19.4. But it never turns
a line around, and in a flow field the nearest point is often the
end of a line. sortLines() looks at both ends
and turns a line around (reverse()) when its end is
closer. With the lines pointing the right way the extension gets to
3.1 meters; that is about 16 meters, and minutes of plotting, less.
Try it yourself, step by step
-
Get the files. Make a folder
flow-fieldand save index.html and sketch.js in it. -
Open it. Double-click
index.html. The drawing appears at its real size, with a thin gray edge for the page. Nothing there? Open the browser console (F12) and read the first error. -
Play. Change
SEED,ZOOM,COUNTorSTEPSinsketch.js, save, and reload the page (F5). Write down the seed of a drawing you like. -
Save. Press S. The file
flow-field.svglands in your downloads. Safari first shows a message from p5.js with instructions for saving; Chrome, Edge and Firefox simply download the file. -
Check in Inkscape. Open the SVG. Under
File › Document Properties the page must be 297 by 210
mm. The lines are already
<path>elements, so Object to Path is not needed (doing it anyway does no harm). - Make the G-code and plot. Run the LY Drawbot extension, check in UGS that the drawing stays within 310 by 210 mm, set the zero point and start, as in the LY Drawbot note.
Easy to forget
-
No
background(). With the SVG renderer it adds a white rectangle the size of the page. The extension skips rectangles, but after Object to Path it is a path, and the extension plots every path, also one without a line: a frame around the page that you did not draw. -
noFill(). A plotter draws lines only. A filled shape comes out as its outline at best; filling an area means drawing lines inside it, as in the Paper.js note. -
noLoop(). Without it,draw()runs 60 times a second; with random numbers in it you get a new drawing every frame, and asave()indraw()saves every frame.
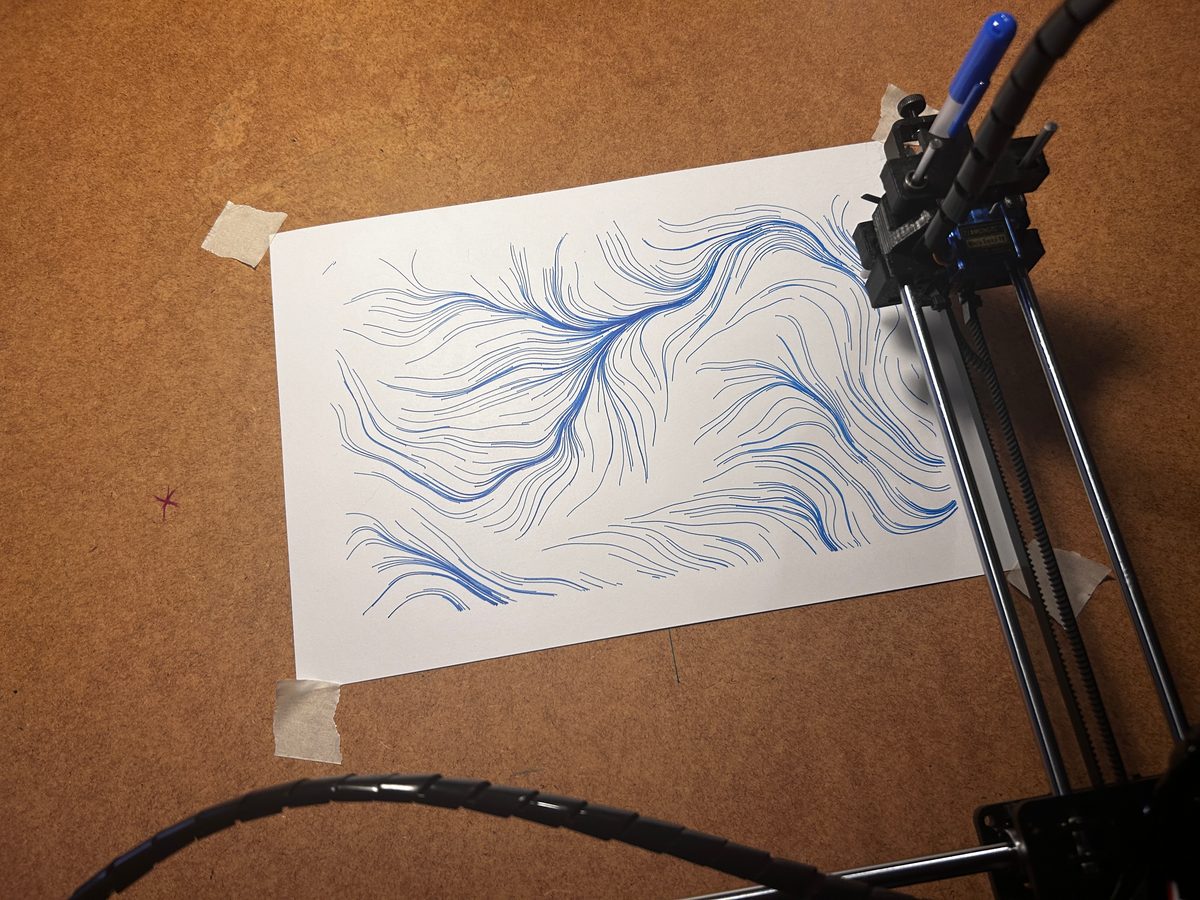
The plot
Sources
- p5.js reference and the p5.js README (history, versions)
- p5.js-svg (README: compatibility with p5.js 1.11.x)
- p5.js web editor
- The Nature of Code, by Daniel Shiffman, free online (with a chapter on flow fields)
-
LY-Drawbot-Tool-by-LOD
(
plotter-lod.py: which elements it reads, and how it orders the lines)