Paper.js: Hidden Lines and Hatching for a Pen Plotter
A vector library that remembers every shape: what Paper.js is, why cutting shapes is the plotter's way to show depth, and overlapping hatched circles that come out in millimeters, ready for the LY Drawbot.
What Paper.js is
Paper.js calls itself "the Swiss
Army Knife of Vector Graphics Scripting". It is made by Jürg Lehni
and Jonathan Puckey and is the successor of Scriptographer, a
plug-in with which you could program Adobe Illustrator. You still
notice that origin: Paper.js thinks in paths, segments and Bézier
curves, like a drawing program. It is free and open source (MIT
license) and draws on a <canvas> in the browser.
The big difference with p5.js: p5.js draws and forgets, Paper.js remembers. Every shape is an object in a tree, the scene graph: a project holds layers, layers hold paths and groups. A circle you drew a minute ago can still be moved, rotated, or cut by another shape.
For two years there was no new release: 0.12.18 is from July 2024. In October 2026 development picked up again, with six releases in four days, from 0.12.19 on 18 October to 0.16.0 on 21 October (new options for SVG import and export, text along paths and inside shapes). This note uses 0.16.0.
PaperScript or JavaScript
The examples on paperjs.org are mostly written in
PaperScript, a JavaScript dialect in which you can
calculate with points directly (point + [10, 0]). It
needs paper-full.js. This note uses plain JavaScript
with the smaller paper-core.js, for two reasons: what
you learn works everywhere, and a PaperScript in a separate file is
fetched with an
HTTP request, which browsers block for a page opened as a file. With plain
JavaScript, a double click on index.html is enough.
Why Paper.js for a plotter
On a screen you hide something by painting over it: draw a circle with a white fill on top of a pattern, and the pattern disappears behind it. The SVG file still contains every line of the pattern, and a plotter draws lines, not fills. It plots the pattern and the circle on top of each other.
What the plotter needs is that the hidden parts of the lines are really gone from the file. That is what Paper.js's boolean operations do:
| Method | Result |
|---|---|
a.unite(b) |
One shape that covers both. |
a.subtract(b) |
A without the part that B covers. |
a.intersect(b) |
Only the part where A and B overlap. |
a.exclude(b) |
Both, without the overlap. |
Normally they treat both paths as areas. For a line that is nothing:
a line has no area, so
line.intersect(circle) returns an empty path. With
{ trace: false } Paper.js only cuts the line where it
crosses the other shape and keeps the pieces of the line itself:
line.intersect(circle, { trace: false }) is the part of
the line inside the circle. That one option is the key to hatching
and hidden lines.
Getting started
Paper.js is one file. The page below loads it from the internet,
gives it a <canvas> to draw on, and then runs
your sketch.js. Put both files in one folder and open
index.html in Chrome, Edge or Firefox; no web server is
needed. To work offline, download
paper-core.min.js from the address in the page, put it
in the folder and change the src to its name.
<!doctype html>
<html lang="en">
  <head>
    <meta charset="utf-8" />
    <title>Circles</title>
    <script src="https://cdn.jsdelivr.net/npm/paper@0.16.0/dist/paper-core.min.js"></script>
    <style>
      body {
        margin: 24px;
        font-family: sans-serif;
      }
      canvas {
        outline: 1px solid #ccc; /* the edge of the A4 page */
      }
    </style>
  </head>
  <body>
    <p>Press S to save the drawing as circles.svg.</p>
    <canvas id="canvas" width="891" height="630"></canvas>
    <script src="sketch.js"></script>
  </body>
</html>
The canvas is 891 by 630 pixels: the A4 page of 297 by 210 millimeters, three pixels per millimeter.
The example: overlapping circles
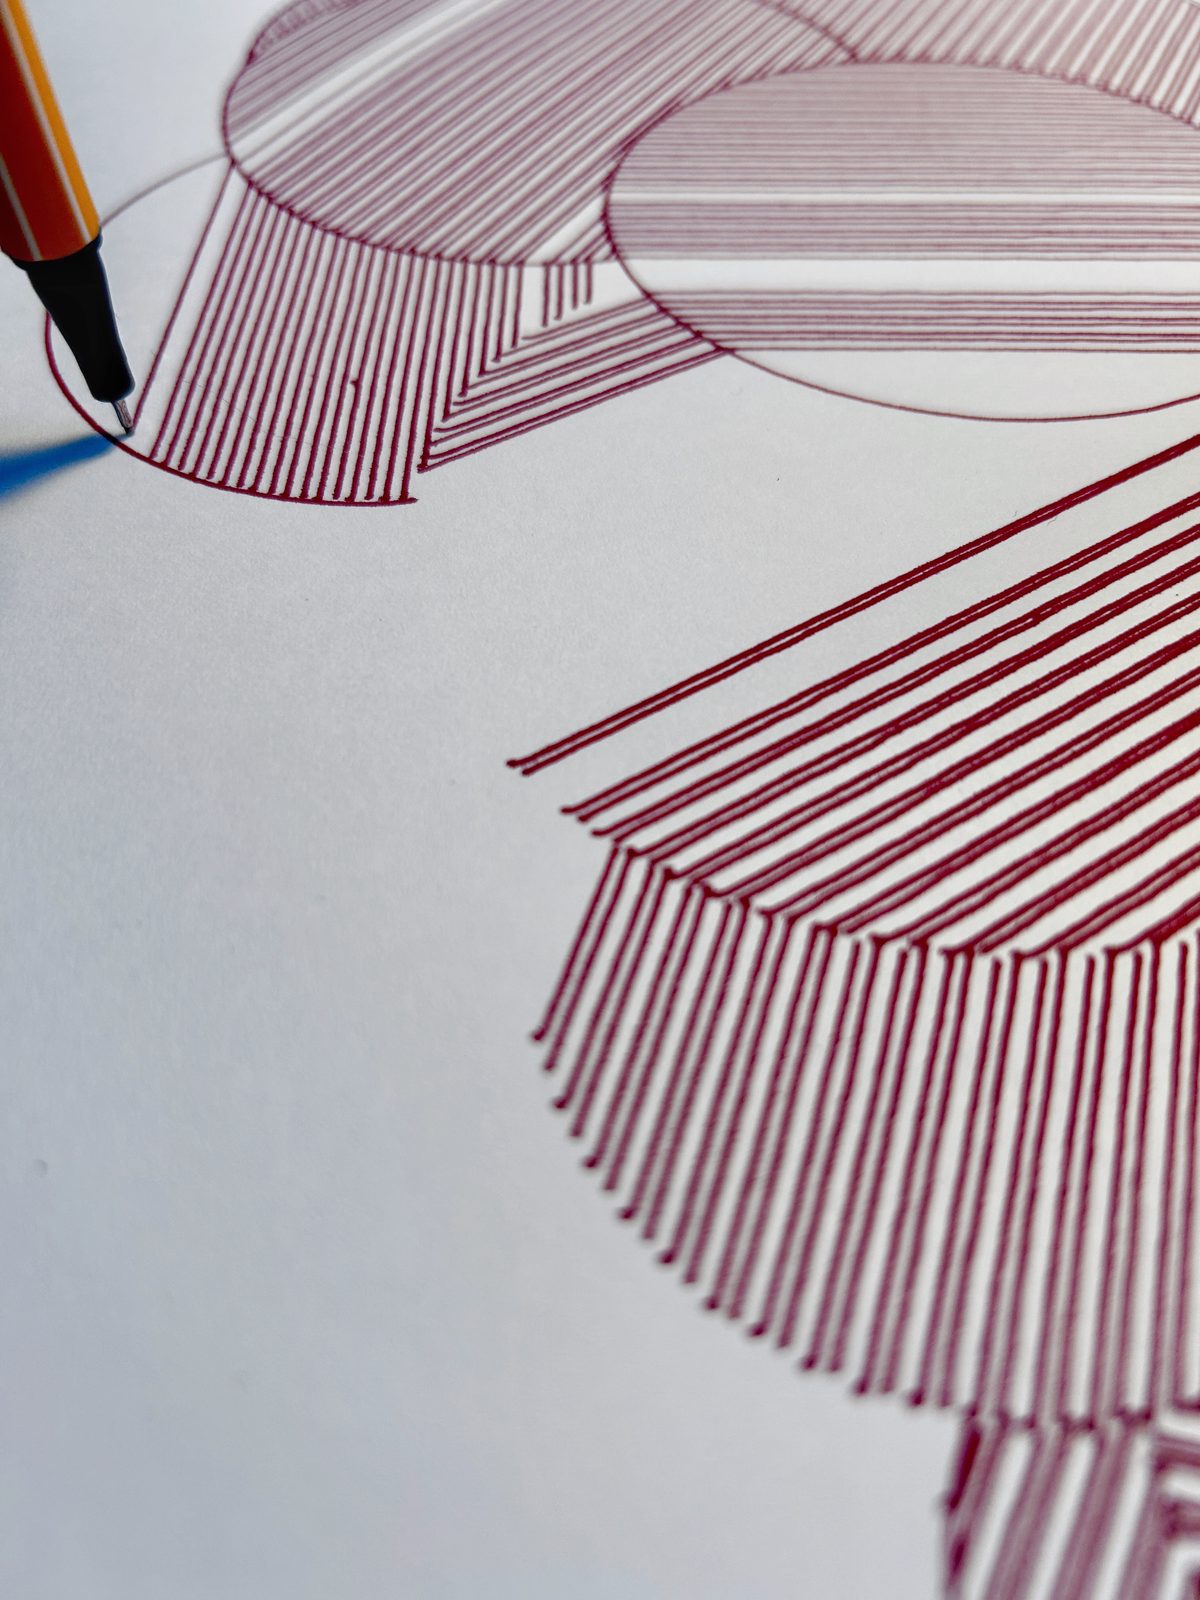
Twelve circles of random size and place, each hatched with lines at its own angle. The circles are made from front to back: the first one lies on top, and every next circle shows only where no circle lies in front of it.
// Overlapping circles, each hatched at its own angle. A circle in front hides
// what lies behind it: the hidden parts of lines are cut away, not painted over.
// Everything is in millimeters on A4 landscape; the screen shows it 3x larger.

const W = 297; // page width, mm
const H = 210; // page height, mm
const MARGIN = 20; // empty border, mm
const SEED = 2; // same seed, same drawing
const COUNT = 12; // number of circles
const GAP = 1.5; // distance between hatch lines, mm

paper.setup("canvas");
paper.view.scale(3, new paper.Point(0, 0));
const random = seededRandom(SEED);

let front = null; // everything already drawn: the circles in front
for (let i = 0; i < COUNT; i++) {
  const radius = 15 + random() * 35;
  const center = new paper.Point(
    MARGIN + radius + random() * (W - 2 * (MARGIN + radius)),
    MARGIN + radius + random() * (H - 2 * (MARGIN + radius)),
  );
  const circle = new paper.Path.Circle({ center, radius, insert: false });
  const visible = front ? circle.subtract(front, { insert: false }) : circle;

  // The outline: the circle without the parts behind other circles.
  draw(
    front ? circle.subtract(front, { trace: false, insert: false }) : circle,
  );

  // The hatching: lines across the circle, cut to its visible part.
  const angle = random() * 180;
  let back = false; // every other line the other way, so the pen zigzags
  for (let d = -radius; d <= radius; d += GAP) {
    const line = new paper.Path.Line({
      from: [center.x - radius, center.y + d],
      to: [center.x + radius, center.y + d],
      insert: false,
    });
    line.rotate(angle, center);
    if (back) line.reverse();
    back = !back;
    draw(line.intersect(visible, { trace: false, insert: false }));
  }

  front = front ? front.unite(circle, { insert: false }) : circle;
}

// Put a path on the page as a thin black line.
function draw(path) {
  if (path.isEmpty()) return;
  path.strokeColor = "black";
  path.strokeWidth = 0.3;
  paper.project.activeLayer.addChild(path);
}

// Math.random() gives a new drawing every time; this gives the same one per seed.
// (mulberry32 by Tommy Ettinger, public domain.)
function seededRandom(seed) {
  return function () {
    seed = (seed + 0x6d2b79f5) | 0;
    let t = Math.imul(seed ^ (seed >>> 15), 1 | seed);
    t = (t + Math.imul(t ^ (t >>> 7), 61 | t)) ^ t;
    return ((t ^ (t >>> 14)) >>> 0) / 4294967296;
  };
}

// Save in millimeters: without the 3x zoom, and with mm as the unit.
function saveSvg() {
  const svg = paper.project.exportSVG({ matrix: new paper.Matrix() });
  svg.setAttribute("width", W + "mm");
  svg.setAttribute("height", H + "mm");
  svg.setAttribute("viewBox", `0 0 ${W} ${H}`);
  const file = new Blob([new XMLSerializer().serializeToString(svg)], {
    type: "image/svg+xml",
  });
  const link = document.createElement("a");
  link.href = URL.createObjectURL(file);
  link.download = "circles.svg";
  link.click();
}

document.addEventListener("keydown", (event) => {
  if (event.key === "s" || event.key === "S") saveSvg();
});
What it does:
-
paper.setup("canvas")connects Paper.js to the canvas with that id.paper.view.scale(3, …)zooms the view: the sketch works in millimeters, the screen shows three pixels per millimeter. -
frontis the area of all circles made so far: one shape, grown withunite()after every circle. -
visibleis the new circle minus that area: the part you can see. The outline is the same subtraction withtrace: false, so you get the visible arcs of the circle's line, not a closed shape. -
The hatching: lines one and a half millimeters apart across the
circle, rotated to the circle's angle, each cut to the visible
part with
intersect(visible, { trace: false }). Every other line is turned around withreverse(), so the pen goes back and forth instead of returning to the same side every time; see below. -
insert: falsekeeps every shape off the page untildraw()adds it. Without it, the circles, the full hatch lines and thefrontarea would all end up in the file. -
seededRandom()gives the same drawing for the sameSEED. JavaScript'sMath.random()cannot be seeded; this small generator (mulberry32) can. It is a closure: the returned function keeps its ownseed. -
saveSvg()exports withmatrix: new paper.Matrix()(the identity matrix: no zoom), so the coordinates are millimeters, and setswidth,heightandviewBoxto match. Without the matrix option, the export contains the zoom: a page of 891 by 630 with everything scaled three times.
The order of the lines
The LY Drawbot's Inkscape extension decides the order itself: each time it picks the line whose start is nearest to where the pen is, but it never turns a line around. If all hatch lines of a circle point the same way, the nearest start is always on the other side, and the pen travels 18.6 meters lifted for this drawing. With every other line reversed, the end of one line is right next to the start of the next, and that drops to 1.5 meters.
Try it yourself, step by step
-
Get the files. Make a folder
circlesand save index.html and sketch.js in it. -
Open it. Double-click
index.html. The circles appear on a page with a thin gray edge. Nothing there? Open the browser console (F12) and read the first error. -
Play. Change
SEED,COUNTorGAPinsketch.js, save, and reload the page (F5). A smallerGAPgives darker circles, and more line to plot. -
Save. Press S. The file
circles.svglands in your downloads. -
Check in Inkscape. Open the SVG. Under
File › Document Properties the page must be 297 by 210
mm. Everything is already a
<path>, so Object to Path is not needed. - Make the G-code and plot. Run the LY Drawbot extension, check in UGS that the drawing stays within 310 by 210 mm, set the zero point and start, as in the LY Drawbot note.
Easy to forget
-
insert: falseon helper shapes. A shape that is on the page is exported, also without a stroke. The extension does not look at the stroke and plots every path, so invisible helper shapes come out on paper. -
trace: falsefor lines. Without it, a boolean operation on a line returns an empty path, and the hatching silently disappears. -
Export without the zoom. Without
matrix: new paper.Matrix()the file is 891 by 630 with ascale(3,3)inside: three times too large for the extension, which reads the numbers as millimeters.
The plot
Sources
- About Paper.js, the reference and the tutorial on using JavaScript directly
- Paper.js source and its change log
- Paper.js sketch, the playground
- mulberry32 by Tommy Ettinger (public domain)
-
LY-Drawbot-Tool-by-LOD
(
plotter-lod.py: which elements it reads, and how it orders the lines)