Turtle Graphics on a Pen Plotter: Keeping the Pen Down
The turtle's commands are almost a plotter's commands: a small Python class that turns turtle programs into an SVG in millimeters, why a tree that looks right on screen draws every line twice on paper, and a curve drawn as one unbroken line.
Why a turtle suits a plotter
In the
note on turtle graphics the
turtle drew in a window. But it started out on paper: Logo's first
turtles were robots on the floor, and PENUP and
PENDOWN were among their basic commands. A pen plotter
is that same idea on rails. The commands translate almost one to one
into what the
LY Drawbot receives from
its Inkscape extension:
| Turtle | G-code from the extension | What the machine does |
|---|---|---|
t.pendown() |
M03 S<power>, then a short wait |
The servo lowers the pen |
t.forward(100), pen down |
G1 X… Y… |
Draws a straight line |
t.penup() |
M05 S0, then a short wait |
The servo lifts the pen |
t.forward(100), pen up |
G1 X… Y… |
Moves without drawing |
One command has no counterpart: t.left(90). The plotter
has no direction it is facing. Turning exists only in the program,
which uses it to work out where the next point is.
Why not Python's own module
Python's turtle draws on a Tk canvas in a window. What
it can save is PostScript, with Screen.save() since
Python 3.14. The LY Drawbot extension wants something else: an SVG
with <path> elements, with coordinates in
millimeters. So the simplest route is not to convert anything, but
to write a small turtle that keeps its lines in a list and writes
that SVG itself.
A turtle that saves an SVG
plotter_turtle.py has the commands from the previous note, with the same names and the same meaning, and needs nothing but Python 3.8 or later. It opens no window, so it also works on a computer without a screen.
"""A small turtle that draws on paper: the same commands as Python's turtle,
but instead of opening a window it saves an SVG for a pen plotter.

Every stroke (pen down to pen up) becomes one <path>, and the drawing is scaled
to fit the page, with one SVG unit per millimeter. Needs only Python itself.

Usage:
    from plotter_turtle import Turtle

    t = Turtle()
    t.forward(100)
    t.left(90)
    t.forward(100)
    t.save("drawing.svg")
"""
import math


class Turtle:
    def __init__(self):
        self.x = 0.0
        self.y = 0.0
        self.angle = 0.0  # degrees, 0 = east, counterclockwise, as in Python's turtle
        self.is_down = True
        self.strokes = []
        self.stroke = [(0.0, 0.0)]

    def forward(self, distance):
        radians = math.radians(self.angle)
        self.goto(self.x + distance * math.cos(radians),
                  self.y + distance * math.sin(radians))

    def back(self, distance):
        self.forward(-distance)

    def left(self, degrees):
        self.angle = (self.angle + degrees) % 360

    def right(self, degrees):
        self.left(-degrees)

    def goto(self, x, y):
        self.x, self.y = x, y
        if self.is_down:
            self.stroke.append((x, y))

    def setheading(self, degrees):
        self.angle = degrees % 360

    def penup(self):
        self.is_down = False
        self._end_stroke()

    def pendown(self):
        if not self.is_down:
            self.is_down = True
            self.stroke = [(self.x, self.y)]

    def _end_stroke(self):
        if len(self.stroke) > 1:
            self.strokes.append(self.stroke)
        self.stroke = []

    # The short names, and two commands that mean nothing on paper.
    fd = forward
    bk = back
    lt = left
    rt = right
    pu = up = penup
    pd = down = pendown

    def speed(self, speed):
        pass

    def hideturtle(self):
        pass

    def save(self, filename, width=297, height=210, margin=15):
        """Scale the drawing to fit the page and save it. Sizes in millimeters."""
        if self.is_down:
            self._end_stroke()
            self.stroke = [(self.x, self.y)]

        points = [point for stroke in self.strokes for point in stroke]
        left = min(x for x, y in points)
        right = max(x for x, y in points)
        bottom = min(y for x, y in points)
        top = max(y for x, y in points)
        scale = min((width - 2 * margin) / (right - left or 1),
                    (height - 2 * margin) / (top - bottom or 1))
        offset_x = (width - scale * (right - left)) / 2 - scale * left
        offset_y = (height - scale * (top - bottom)) / 2 + scale * top

        paths = []
        drawn = 0.0
        for stroke in self.strokes:
            page = [(offset_x + scale * x, offset_y - scale * y) for x, y in stroke]
            drawn += sum(math.dist(a, b) for a, b in zip(page, page[1:]))
            d = "M" + " L".join(f"{x:.2f} {y:.2f}" for x, y in page)
            paths.append(f'  <path d="{d}"/>')

        with open(filename, "w", encoding="utf-8") as file:
            file.write(
                f'<svg xmlns="http://www.w3.org/2000/svg" width="{width}mm" '
                f'height="{height}mm" viewBox="0 0 {width} {height}" '
                'fill="none" stroke="black" stroke-width="0.4" '
                'stroke-linecap="round" stroke-linejoin="round">\n'
                + "\n".join(paths) + "\n</svg>\n"
            )
        print(f"{filename}: {len(paths)} stroke(s), {drawn / 1000:.1f} m of line, "
              f"1 step = {scale:.2f} mm")
Three things in it matter for the plotter:
-
Strokes. Everything from pen down to pen up is
one stroke, and each stroke becomes one
<path>. The number of strokes is the number of times the pen goes down. -
Steps and millimeters. A turtle step has no size.
savescales the whole drawing to fit an A4 landscape page with a 15 mm margin, and prints what one step became. Sot.forward(100)is not 100 mm. -
Up is up. A turtle's y runs upward and an SVG's
runs downward, so
saveflips it. The drawing comes out the way it looks in the turtle window.
It leaves out what a plotter cannot use, such as colors and fills,
and also t.circle, which you can walk yourself with
many short steps. speed and hideturtle do
nothing, so that programs from the screen keep working.
The snowflake: almost unchanged
Here is the Koch snowflake from the previous note. Only the import,
the creation of the turtle and the last line are different:
t.save instead of turtle.done(). The
starting position is gone too, because save centers the
drawing anyway. And I raised the depth from 3 to 4, because paper
can take it.
from plotter_turtle import Turtle

DEPTH = 4


def koch(t, length, depth):
    if depth == 0:
        t.forward(length)
        return
    for turn in (60, -120, 60, 0):
        koch(t, length / 3, depth - 1)
        t.left(turn)


t = Turtle()

for side in range(3):
    koch(t, 300, DEPTH)
    t.right(120)

t.save("koch.svg")
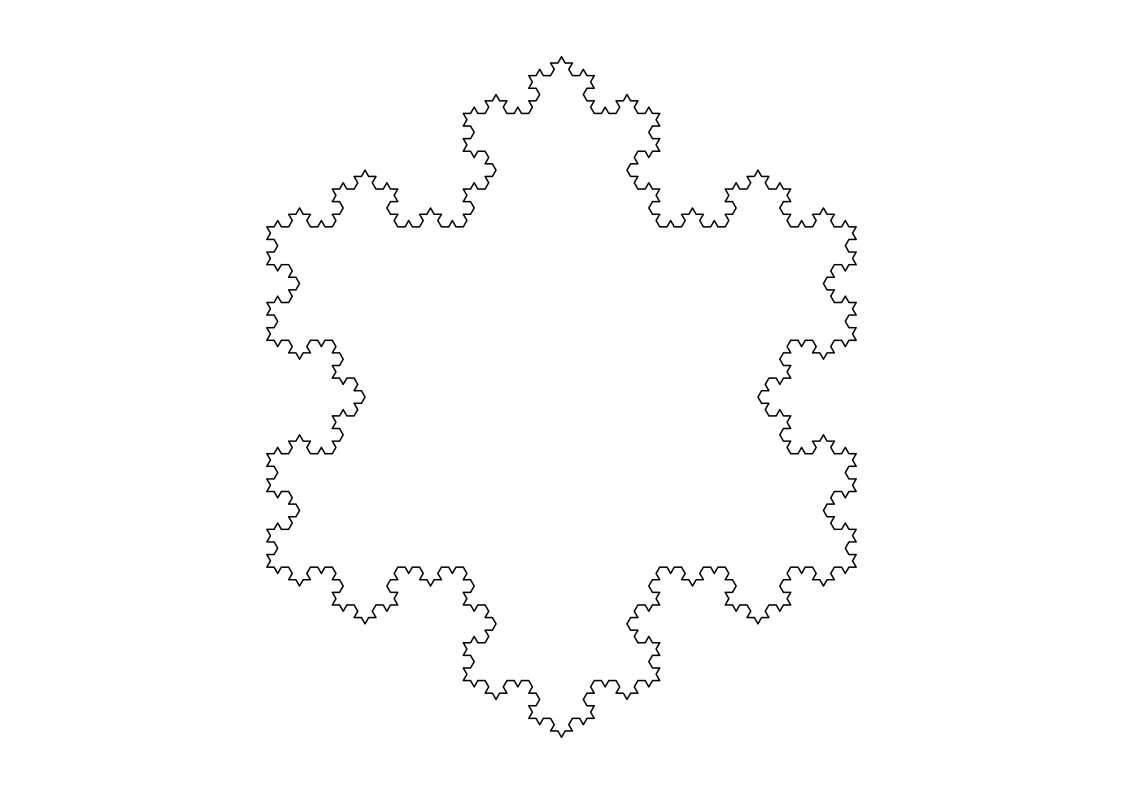
koch.svg: 1 stroke(s), 1.5 m of line, 1 step = 0.52 mm
koch.svg on its A4 page. Download it under
Try it yourself.
One stroke: the pen goes down at the start and comes up after 1.5 m, right where it began.
The tree: what a screen hides
The recursive tree from the previous note ends each branch with
t.back(length), so that the turtle leaves things as it
found them. In a window you see nothing of this: walking back over a
line leaves the same pixels. On paper, the pen goes back over every
branch. Without changing anything, the plotter draws the whole tree
twice.
That costs time, it puts twice the ink in the same place, and a
second pass rarely lands exactly on the first: any play in the
machine shows up as a line that looks thicker or doubled. The remedy
is to lift the pen for the walk back. These three lines replace
t.back(length):
from plotter_turtle import Turtle


def branch(t, length, depth):
    if depth == 0:
        return
    t.forward(length)
    t.left(25)
    branch(t, length * 0.75, depth - 1)
    t.right(50)
    branch(t, length * 0.75, depth - 1)
    t.left(25)
    t.penup()
    t.back(length)
    t.pendown()


t = Turtle()
t.left(90)

branch(t, 100, 8)

t.save("tree.svg")
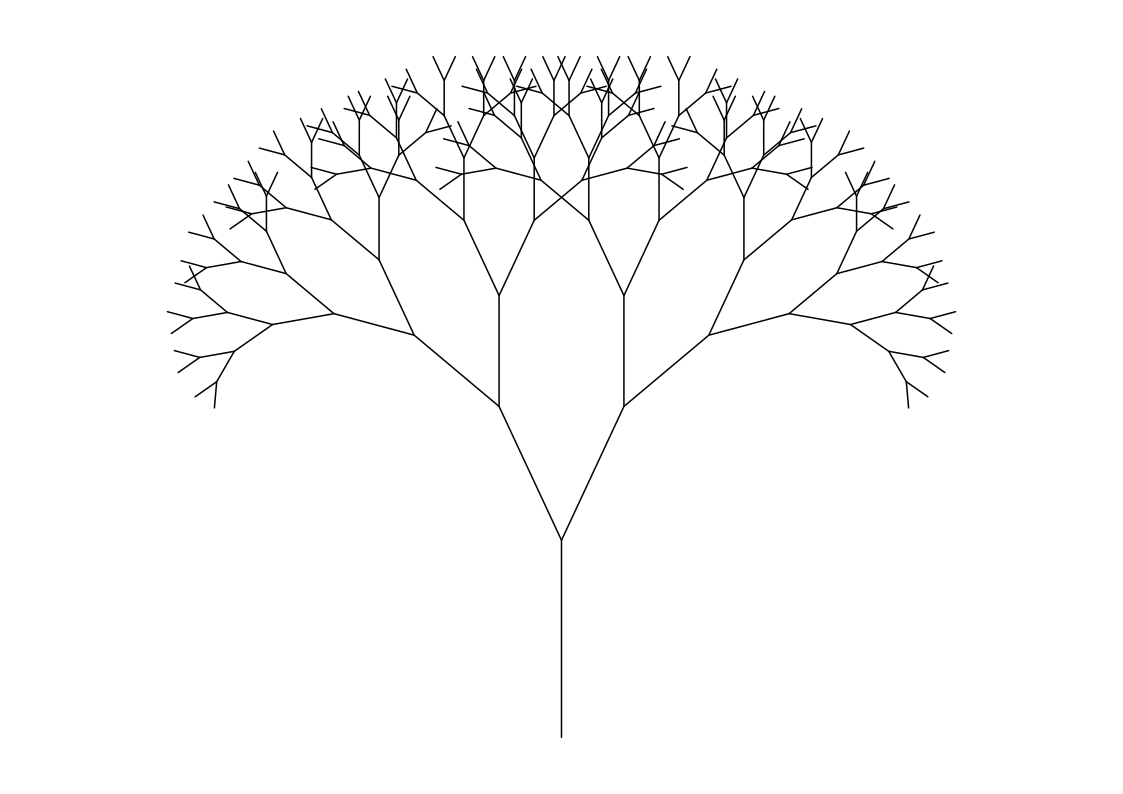
tree.svg: 128 stroke(s), 2.6 m of line, 1 step = 0.52 mm
tree.svg on its A4 page. The version that walks back
with its pen down looks exactly the same: that is the problem.
That solves the double line, but it is not free. The tree has 128 tips, and every tip now needs its own stroke. The table has the measurements, with pen-up travel calculated for the order in which the extension draws the paths:
| Tree | Pen goes down | Drawn | Pen-up travel | Every line |
|---|---|---|---|---|
| Walking back with the pen down | 1 time | 5.13 m | 0.15 m | Twice |
| Walking back with the pen up | 128 times | 2.57 m | 2.96 m | Once |
Note the total distance: 5.28 m against 5.53 m. Lifting the pen does not make the plot shorter, and it adds 127 pen lifts, each with its waiting times. What you gain is a cleaner line and less ink. Pens that leave a dot or a blob where they land may do better with fewer landings, so it depends on the pen.
The Hilbert curve: one unbroken line
Some turtle drawings seem made for a plotter because the pen never has to lift at all. The Hilbert curve, described by David Hilbert in 1891, is one line that visits every cell of a square grid, without crossing itself. The turtle draws it with a recursive function that calls itself with the turn flipped:
from plotter_turtle import Turtle

ORDER = 5


def hilbert(t, order, turn):
    if order == 0:
        return
    t.left(turn)
    hilbert(t, order - 1, -turn)
    t.forward(10)
    t.right(turn)
    hilbert(t, order - 1, turn)
    t.forward(10)
    hilbert(t, order - 1, turn)
    t.right(turn)
    t.forward(10)
    hilbert(t, order - 1, -turn)
    t.left(turn)


t = Turtle()

hilbert(t, ORDER, 90)

t.save("hilbert.svg")
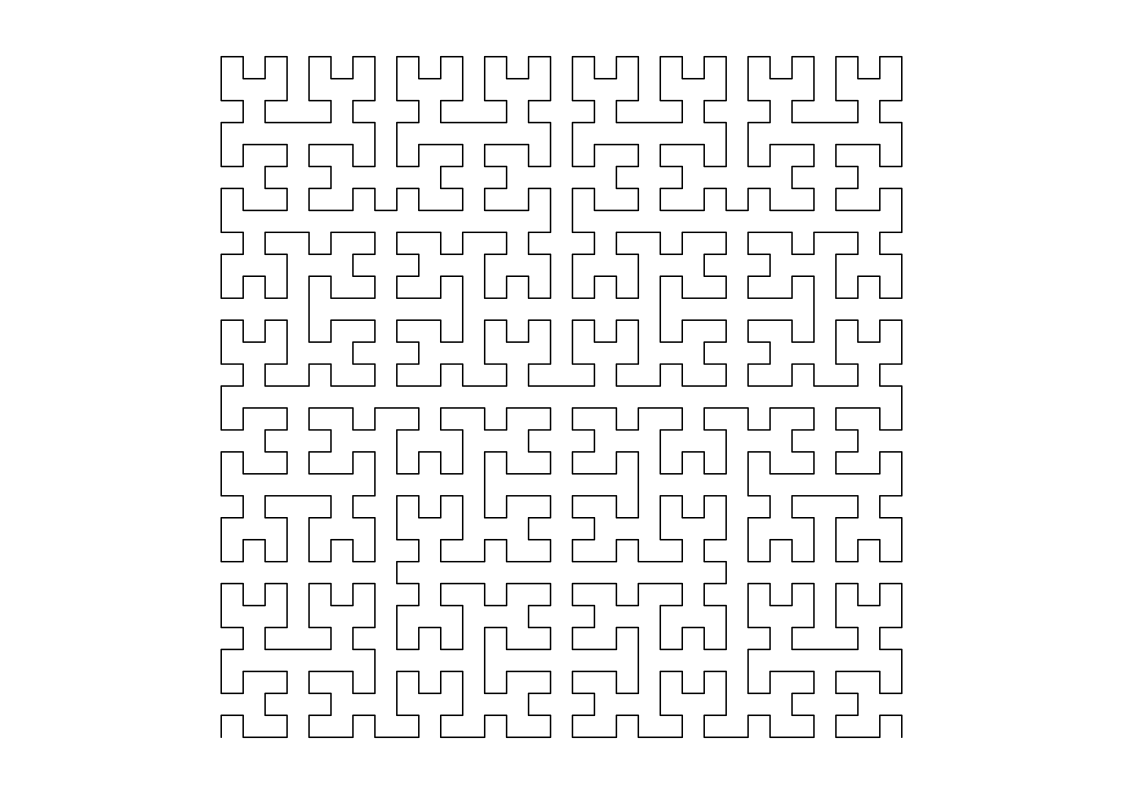
hilbert.svg: 1 stroke(s), 5.9 m of line, 1 step = 0.58 mm
hilbert.svg on its A4 page: one line of 5.9 m.
Every higher order doubles the number of cells per side, so the length nearly doubles while the page stays the same size. The grid spacing tells you which pens can still do it:
ORDER |
Spacing of the lines | Length of the line |
|---|---|---|
| 3 | 25.7 mm | 1.6 m |
| 4 | 12.0 mm | 3.1 m |
| 5 | 5.8 mm | 5.9 m |
| 6 | 2.9 mm | 11.7 m |
| 7 | 1.4 mm | 23.2 m |
With a single stroke, there is no pause in which a pen can recover. If a pen skips or runs dry after 10 m, it shows. Try a new pen on a lower order first.
Easy to forget
- Line density. On screen, lines that pile up are just black. On paper, they are wet ink on the same spot. The spiral with a turn of 91 degrees from the previous note has places where many lines nearly touch; the 170-degree star passes close to its center 36 times. Beautiful, but a test for your paper.
-
Stay in landscape. The LY Drawbot reaches 310 mm
in X but only 210 mm in Y. A portrait page, with
t.save("x.svg", width=210, height=297), does not fit. -
Changing the size. Because
savescales to the page, a largerforwardchanges nothing. Usemarginto make the drawing smaller, for instancet.save("x.svg", margin=50). -
A random walk. With
random, userandom.seed(7), so you can make the drawing you liked again.
Try it yourself, step by step
- Get the files. Make a folder and save plotter_turtle.py in it, with one or more of koch.py, tree.py and hilbert.py.
-
Run it. In that folder,
python3 hilbert.py(on Windows usuallypython hilbert.py). It prints one line and writeshilbert.svg. Prefer to go straight to the plotter? Here are koch.svg, tree.svg and hilbert.svg. -
Check in Inkscape. Open the SVG. Under
File › Document Properties the page must be 297 by 210
mm. The lines are already
<path>elements, so Object to Path is not needed. - Make the G-code and plot. Run the LY Drawbot extension, check in UGS that the drawing stays within 310 by 210 mm, set the zero point and start, as in the LY Drawbot note.
The plot
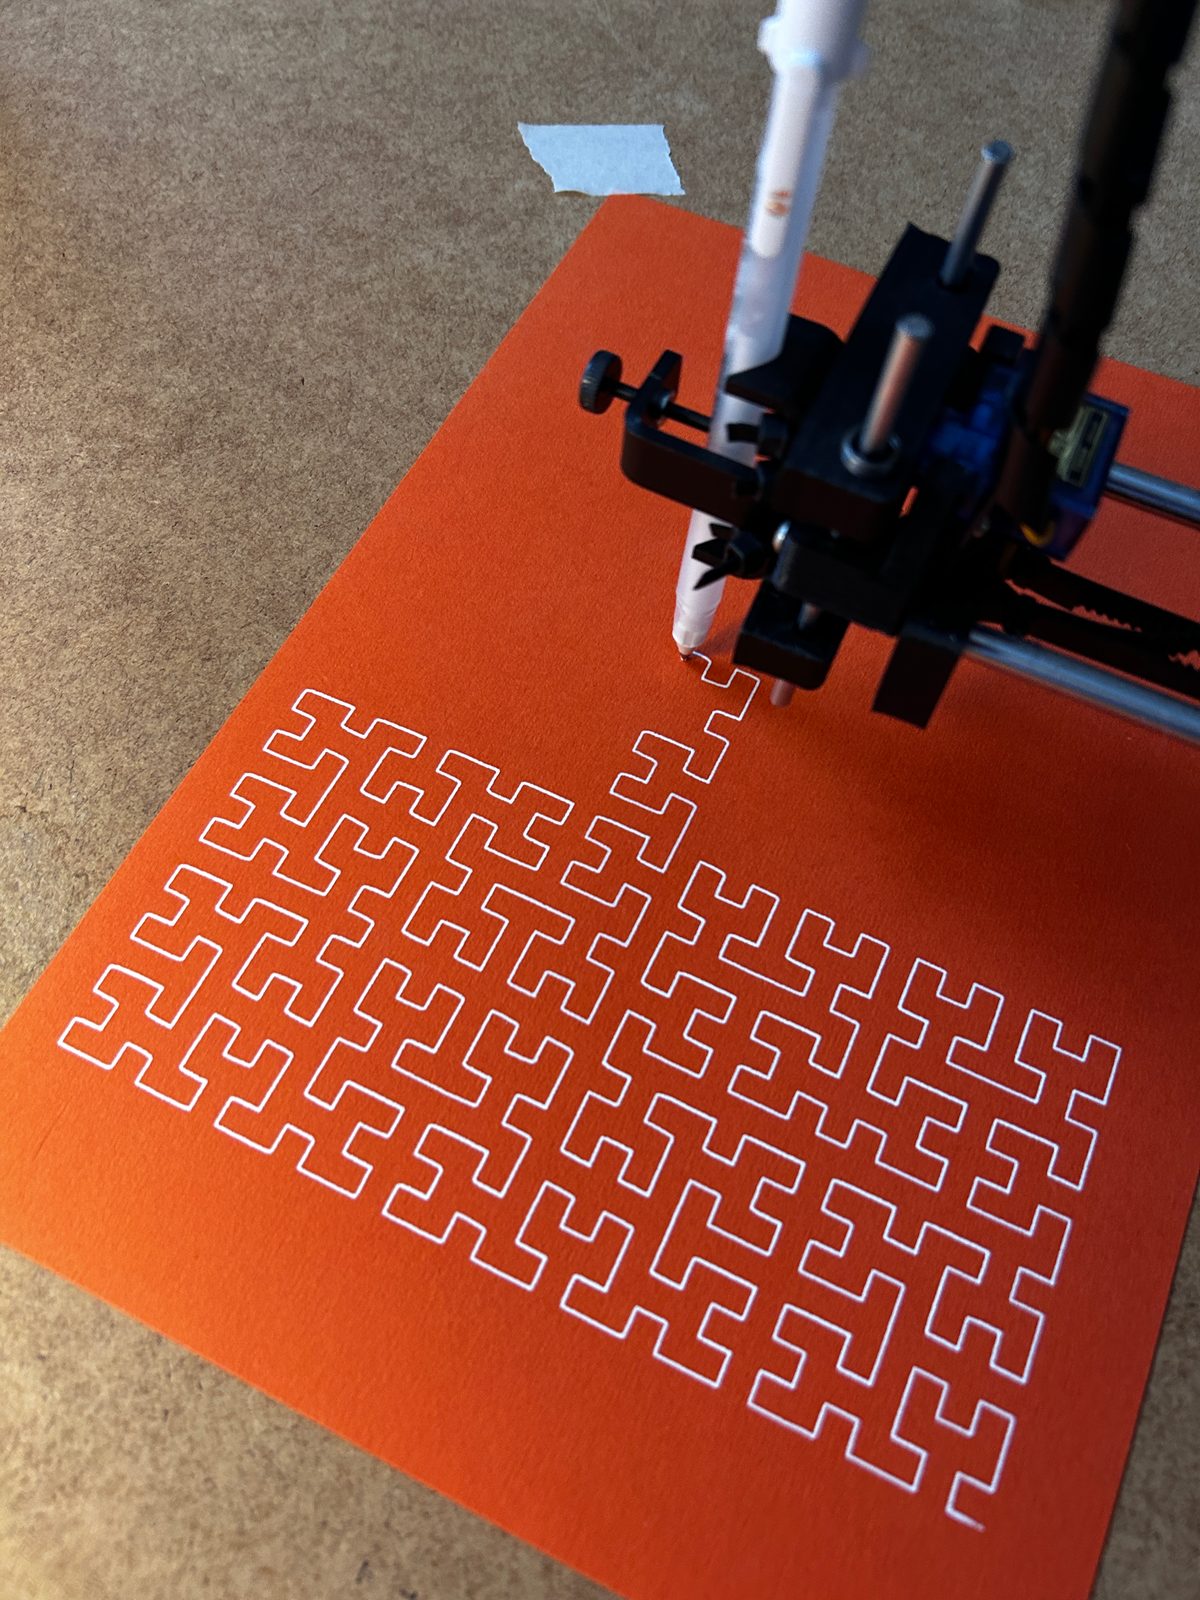
In the Turtle Editor
The scripts on this page do not run unchanged in the
Turtle Editor from
the previous note. They use plotter_turtle, which draws
nothing on screen, and the editor does not find that file. The
editor has its own route: you draw with Python's
turtle, and its Save SVG button writes what is on the
canvas to the same kind of file, with one
<path> per stroke.
To use a script from this page there, change the import and the line that creates the turtle, and add a line for the speed:
import turtle         # was: from plotter_turtle import Turtle

t = turtle.Turtle()   # was: t = Turtle()
t.speed(0)            # new: otherwise the drawing takes a long time
Remove the line with t.save, press Run, and when the
drawing is finished, press Save SVG. The snowflake, the tree and the
Hilbert curve then come out with the same strokes as the SVG files
on this page.
-
The page is fixed. Save SVG always writes A4
landscape with a margin of 15 mm. For another margin, use
plotter_turtle. - Only lines are saved. Colors and pen sizes do not reach the file. Dots, stamps, fills and text are left out too, and the editor tells you when that happens.
- Off the canvas is still in the file. The Hilbert curve runs past the right edge of the window, but the SVG has all of it.
Or in the browser
The editor below runs the same turtle code in your browser, with
Skulpt, a version of Python that works inside a web page. It already
holds the snowflake, the tree and the Hilbert curve, changed as
above: pick one under Example, press Run, and when the drawing is
finished, press Save SVG. The file gets the name of the program, such
as koch.svg.
Skulpt imitates Python 3 and its turtle module; it is not the real
Python. The three programs here give the same strokes as the SVG
files on this page, but less common commands may be missing or
behave differently: undo(), for example, does nothing
here.
Sources
- Cynthia Solomon and others, History of Logo, Proceedings of the ACM on Programming Languages 4, HOPL, Article 79 (June 2020): the floor turtles and their commands
-
turtle: Turtle graphics, Python documentation, for the commands and
Screen.save - LY-Drawbot-Tool-by-LOD, source of the Inkscape extension, for the G-code and the order of the paths
- David Hilbert, Ueber die stetige Abbildung einer Line auf ein Flächenstück, Mathematische Annalen 38 (1891)